
Hotel Occupancy Above Pre-Recession Levels, REVPAR & ADR Gaining Ground

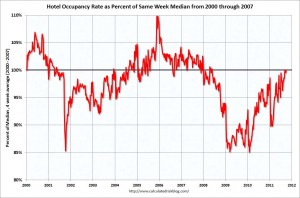
Line graph showing U.S. hotel occupancy rates as a percent of the 2000–2007 median, from 2000 to 2012. The rate fluctuates, dips steeply around 2008–2009, then rises and stabilizes near or above the median after 2010.

We have not checked in with our favorite financial blog, Calculated Risk,  in a while.  We are pleased to see the incredible progress hotels have made in both occupancy and ADR. Occupancy has now recovered to the median after falling off a cliff in 2008.  REVPAR is now about 3 percent below the median.  Check out the full details by clicking on the graph.


Source:  Calculated Risk

California to See a Record Number of Hotel Foreclosures

According to an article by Alan X. Reay that appears on hotelnewsnow.com, the number of CA hotels in default or foreclosed on jumped 125 percent in the last 60 days and the state now has 31 hotels that have been foreclosed on and 175 in default.  Not surprisingly about 87 percent of the hotels in default are non-franchised hotels.  Also, 75 percent of the hotels that are in default were either purchased or refinanced between 2005 and 2007.

The author estimates that hotel values are currently 50-80% lower than the peak as a result of declining revenues.